Value Added Medical Products (VAMP) (B) Case Study Solution
Cash Position of VAMP:
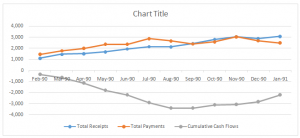
Exhibit 4 shows the high payment requirement against the total number of receipts, which are low as compared to the total number of payments. The curve for cumulative cash flows shows the downward trend that means Value Added Medical Products Company is facing difficulties in data payments since March 1990. This decline in cumulative cash flows resulted in breaching of many covenants at the start of 1990.
Alternate 1:
First alternative came from the Min base or other strategic buyers who want to buy the VAMP Company. After detailed negotiation with them, Williams is interested in sale of VAMP with Min base at discount. Min base is a company that fits with VAMP’s culture. The close deal with Min base seems to be a good option in order to secure the VAMP’s future.
Alternate 2:
Second alternate is related to the detailed negotiation with existing financers and investors of VAMP Company, which are the Lazard Ventures, Intermediate Capital Group (ICG), 3i management and Pearson. The attitude of 3i management towards negotiation is positive and they wants to participate in deal in which they will provide up to 500,000 sterling pounds to VAMP Company while ICG wants to convert its investment into loan by providing additional 1 million sterling pounds as loan. Lazard Ventures would not be provide any more funds to VAMP while Pearson agreed to provide 3.5 to 4 million sterling pounds to VAMP, but rejected its offer after closing the deal with Min base. After all ups and downs, only ICG was left in the ring. That is why VAMP management should negotiate with Pearson to provide 2 to 3 million sterling pounds, in order to save the VAMP’s future.
Alternate 3:
The last option left for Williams is to liquidate the VAMP Company by selling off all of its assets for the purpose of repaying all of its obligations. This option has been considered the least favorable option.
Recommendation and Conclusion:
Sales of database has been observed slow for the company that is why investors and financers of the company believe that the sale of the company to strategic buyer is the best possible solution for VAMP Company’s future. But this option is no more available as Min base has closed the deal. So, the only option remaining for Williams and VAMP’s management is to convince Pearson to invest at least 2 to 3 million sterling pounds in VAMP for the purpose of securing the company’s future and growth.
If another strategic buyer wouldn’t be found within 3 to 5 months then Williams will not be left with any option but to liquidate the VAMP Company for the purpose of repayment of debt to the debt financers.
Exhibit 1: Company’s Forecast
| Company's Forecast | ||
| Indicators | 1991 Forecasts | 1991 Actual |
| GP Margin | 38.78% | 38.92% |
| NP Margin | 29.74% | 37.71% |
| COGS/Sales | 61.00% | 61.08% |
| Sales Growth from 1990 | 21.75% | 33.20% |
| Current Ratio | 0.79 | 0.71 |
| Total Assets Growth from 1990 | 70.18% | 61.12% |
| Overdraft/CL | 38.79% | 55.42% |
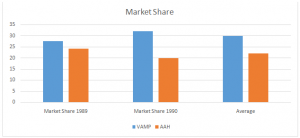
Exhibit 2: Market Share
| VAMP | AAH | |
| Market Share 1989 | 27.6 | 24.2 |
| Market Share 1990 | 32 | 20 |
| Average | 29.8 | 22.1 |
Figure 1: Market Share
Exhibit 3: Company’s Trading Performance
| Company's Trading Performance | ||
| Indicators | 1991 Budgeted | 1991 Actual |
| GP Margin | 47.59% | 46.86% |
| NP Margin | 15.79% | -0.30% |
| Sales Growth | 104.96% | -40.71% |
| Current Ratio | 0.46 | 0.25 |
| Assets Growth | 91.68% | -10.37% |
Exhibit 4: Cash Flows for VAMP Company
| Months | Total Receipts | Total Payments | Cumulative Cash Flows |
| Feb-90 | 1,100 | 1,447 | -347 |
| Mar-90 | 1,461 | 1,767 | -653 |
| Apr-90 | 1,519 | 1,988 | -1,122 |
| May-90 | 1,693 | 2,359 | -1,788 |
| Jun-90 | 1,950 | 2,354 | -2,192 |
| Jul-90 | 2,158 | 2,860 | -2,894 |
| Aug-90 | 2,154 | 2,656 | -3,396 |
| Sep-90 | 2,425 | 2,387 | -3,396 |
| Oct-90 | 2,828 | 2,568 | -3,098 |
| Nov-90 | 3,076 | 3,031 | -3,053 |
| Dec-90 | 2,911 | 2,669 | -2,811 |
| Jan-91 | 3,099 | 2,477 | -2,189 |

