TESLA MOTORS (A): FINANCING GROWTH. Case Solution
Ratio analysis
In order to evaluate company’s financial strength ratio analysis have been conducted for Tesla motors. Debt to equity ratio of the company signifies the increasing trend and indicates that the company uses relative proportion of debt and equity. The company has gradually shifted its financing from equity to debt. Due to which the ratio has increased over the period. The high debt is also an indicator of high risk and returns. The growing debt is an alarming sign for the investors as the company is experiencing negative net income from past few years and still is unable to transform it into positive income. Though the company growing revenue is a sign of relief and is the reason that the investor and lenders are confident enough to provide investment to the company.
The net working capital of the company is also fluctuating, indicating that the company’s cash is tied up into the inventory due to which the company has limited cash to pay back its short term liabilities. The net working capital in the year 2015 has become negative showing that the current liabilities have exceeded company’s current asset and company don’t have sufficient assets to backed its current liabilities.
The performance efficiency can be evaluated by analyzing the company’s operating cycle. The company operating cycle has increased over the period this shows the inefficiency of the company to quickly convert its assets into cash. Due to which the company is facing cash deficiency and will require additional financing in order to run its function smoothly.
The gross profit margin of the company has improved over the year it is mainly because of the increase in the net sales of the company that has grown significantly over the year. Each year the demand of the products has been increasing, as reflected in the revenue of the company which is contributing toward a positive gross margin.
Alternatives
Alternative 1:
The investor should invest in the company as it seems to be a lucrative investment. Though there are some pros and cons attracted with the criteria that should be consider by the investor while opting for this option:
Pros
- Strong sales trend of the company is one of the reasons that attract investor towards the company. Each year the company sales are growing at an increasing rate.
- For the coming Model 3 the company has received 325000 reservations within a first week that represent the future sales of $14 billion. This is more than half of its entire 2016 volume, showing why the investors are so confident, that the future sales will materialize.
- The expected future cash flows of the company are also indicating a positive NPV, making the investment seems financially viable.
Cons
- Tesla’s operating cash and operating margins are both negative.
- Tesla has negative income, and the company without any hesitation seems to compromise its current profits for its future growth.
- The uncertainties of the deliveries and failed promises can brutally affect the share price of the company and its overall image in the market.
Alternative 2
The investor should not invest in the company due to the high uncertainty about the future performance of the company and its unrealistic production benchmark for production, which seems to be unachievable y the company, after analyzing its current production. The pros and cons attached with this decision are as follows:
Pros
- The investor will save himself from the loss because as predicted by some of the analyst at Wall Street, the company shares are underweight as a greater risk is attached relative to demand, execution and competition.
- The investor can effectively utilize its investment in comparatively stable company offering sufficient dividends.
Cons
- Tesla sales has grown to the point where its new affordable model is being recognized and helping the company to easily approach the mass market, making its financial metrics look comparable to major automobile companies.
- The launch of Model 3 carries a tremendous symbolic value, as tesla transition from a niche player to a major automaker in the industry.
Recommendation
Tesla motors, pioneer of the electric car is a great company, it success and image is evident by the enthusiasm of its consumers for its products. After the success of the previous model the company came up with another model targeting the mass market, with the first week of its reservation, the company received 325,000 booking, representing $14 billion in future sales. Looking at this figure the company seems to be a lucrative investment despite of the fact that the company has not yet achieved a positive annual net income, while its stocks is still over valued by 6 out of the 10 Wall Street analyst.
If an investor is looking for a short term investment than is not advisable to invest in Tesla Motors because the company’s operating cash and operating profit margins are both negative because the company heavily invest on the research and development and is ready to forgo short term profit for future growth.
In case of long term the company seems to be a financially viable investment, the net income in the coming years as forecasted in the pro forma income state statement is also seems to be positive with a significantly growing revenue. The median of the targeted price is $305 while the mean is $296.8 and currently the stock is being traded at $211.17, this make the stock a good buy because in case the company’s stock do not reach the price target predicted by Dougherty & Company. The investor investment will still be termed as a lucrative investment because the cumulative mean of the investment is still significantly more than the current price of the stock.
Appendix
Exhibit 1 (Tesla Pro Forma Income Statement)
| 2012 | 2013 | 2014 | 2015 | 2016 | 2017 | 2018 | 2019 | |
| Revenues | ||||||||
| Automotive sales | 385699 | 1921877 | 3007012 | 3740973 | 4863265 | 6322244 | 8218918 | 10684593 |
| Development services | 27557 | 91619 | 191344 | 305052 | 320304.6 | 336319.8 | 356499 | 374324 |
| Total revenues | 413256 | 2013496 | 3198356 | 4046025 | 5183569.5 | 6658564 | 8575417 | 11058917 |
| Cost of revenues | ||||||||
| Automotive sales | 371658 | 1483321 | 2145749 | 2823302 | 3049166.16 | 3293099 | 3556547 | 3841071 |
| Development services | 11531 | 73913 | 170936 | 299220 | 418908 | 586471 | 821060 | 1149484 |
| Total cost of revenues | 383189 | 1557234 | 2316685 | 3122522 | 3468074.16 | 3879571 | 4377607 | 4990555 |
| Gross profit | 30067 | 456262 | 881671 | 923503 | 1715495.34 | 2778994 | 4197810 | 6068362 |
| Operating expenses | ||||||||
| Research and development | 273978 | 231976 | 464700 | 717900 | 969165 | 1308373 | 1766303 | 2384509 |
| Selling, general and administrative | 150372 | 285569 | 603660 | 922232 | 1152790 | 1440988 | 1801234 | 2251543 |
| Total operating expenses | 424350 | 517545 | 1068360 | 1640132 | 2121955 | 2749360 | 3567538 | 4636052 |
| Income/Loss from operations | -394283 | -61283 | -186689 | -716629 | -406459.66 | 29633.3 | 630272 | 1432310 |
| Interest income | 288 | 189 | 1126 | 1508 | 1583 | 1663 | 1746 | 1833 |
| Interest expense | -254 | -32934 | -100886 | -118851 | -124793.55 | -131033 | -137585 | -144464 |
| Other Income (expense) | -1828 | 22602 | 1813 | -41652 | -43318 | -45051 | -46853 | -48727 |
| Income/Loss before income taxes | -396077 | -71426 | -284636 | -875624 | -572988 | -144788 | 447580 | 1240952 |
| Provision for income taxes | 136 | 2588 | 9404 | 13039 | 13300 | 13566 | 13837 | 14114 |
| Net Income/loss | -396213 | -74014 | -294040 | -888663 | -586288 | -158354 | 433743 | 1226838 |
Exhibit 2 (Tesla NPV)
| NPV | $994,889 | |||
| WACC | 12.60% | (calculated by J.P Morgan) | ||
Exhibit 3 (Ratio Analysis)
| 2013 | 2014 | 2015 | ||
| Debt to equity ratio | Total liabilities/Total equity | 2.62293 | 5.35186 | 6.39286 |
| Net working capital | Current assets - Current liabilities | 590779 | 1091491 | -24706 |
| Operating cycle | DIO + DSO – DPO | 17 | 54 | 58 |
| Gross profit margin ratio | Cost of sales | 4266.394521 | 6347.082 | 8554.855 |
| Days Inventory Outstanding | ||||
| Cost of sales | 4266.394521 | 6347.082 | 8554.855 | |
| Average inventory | 79.77579156 | 150.2541 | 149.3699 | |
| Days Sales Outstanding | ||||
| Net sales | 5516.427397 | 8762.619 | 11085 | |
| Average account receivable | 8.902319647 | 25.8603 | 15.24267 | |
| Days payable outstanding | ||||
| Cost of sales | 4266.394521 | 6347.082 | 8554.855 | |
| Average account payable | 71.24727883 | 122.5675 | 107.091 |
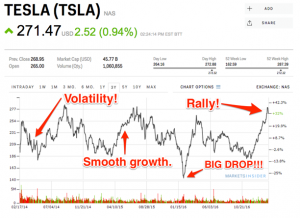
Exhibit 4 (Tesla share price performance)


