Quirky: A Business Based On Making Invention Accessible Case Study Solution
How is it Currently Performing?
As the case presents that there has been a lot of uncertainty for bringing improvements in the operations of the company therefore it is necessary to evaluate the current performance of the company as well. It has been observed that company has come a long way by delivering according to the expectations of the market. Currently Quirky has started to develop products not just for the company itself but it has also created its brand image where it has been considered by largest brands of the world to make products for them. This can be considered as a major achievement for the company since huge brands of the world are considering Quirky as their choice of producing items for them. Over the time, Quirky has also acquired few companies and developed partnership with big firms such as GE, Harman International, and Amazon etc. to move ahead in the market. Company has also focused upon producing fewer products but competitive products in the market which ensures them high profit returns and more sales volume.
By the comparison of Quirky financials 2012 with other companies i.e. Google, General Electric, Johnson and Johnson, given in the Exhibit E, we can analyse that currently the company is not doing well in its financial performance. The major causes of the poor financial measures of the company as compare to others is high costs related to the payment of community rewards, payment for outsourcing production and for third party selling. Company’s huge dependence on its stakeholders for its core business operations makes it, currently, in-competitive in terms of financial performance.
Organizational Culture of Quirky:
The organizational culture of Quirky can be better analysed by the company’s mission to make invention accessible and to generate sustainable business margins without damaging its distinct philosophy of community contribution in product development.
The organization’s culture include high believes about the idea that involving community in the product development has great impact on the overall industries. Providing what the consumers actually want, requires their involvement in various product development phases i.e. pricing, product designing etc., is the core belief of the company.
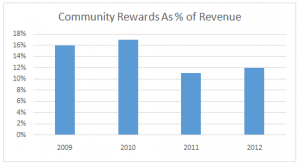
The company’s culture also include high value for its community members, and it gives the value to its community members by spending its 40% revenues as community rewards, in spite of facing losses since its inception. The company has quite integrated culture in which each and every decision about a product is taken on the basis of mutual discussions.
Although, its culture has made it a successful company in terms of increasing revenues, product range, number of consumers, consumer’s loyalty etc., but it has also proved to be a large barrier for company to earn substantial margins. The organizational culture has provided it a distinct nature and a competitive advantage, but it has also resulted in the increasing complexity within the organization with the increasing number of members. If the company wants to position itself as a competitive player in the market in long run, it should revise its culture to the extent where the culture would manage its distinct identity as well as would bring certain margins to make company exist in the long run.
Exhibit A: Quirky Income Statement
| Income Statement of Quirky in 000 of dollars (2009-2012) | |||||
| 2009 | 2010 | 2011 | 2012 | ||
| Revenue | 62 | 1165 | 6553 | 16723 | |
| Cost of Goods sold | 43 | 944 | 4723 | 12800 | |
| Gross Profit | 19 | 221 | 1830 | 3923 | |
| Community Rewards | 10 | 198 | 722 | 2046 | |
| Operating and other Expenses | 622 | 3780 | 10816 | 18019 | |
| Total Operating Expenses and Rewards | 632 | 3978 | 11538 | 20065 | |
| Net Income | -613 | -3757 | -9708 | -16142 | |
Exhibit B: Vertical Analysis
| Vertical Analysis of Quirky (2009-2012) | |||||
| 2009 | 2010 | 2011 | 2012 | ||
| Revenue | 100% | 100% | 100% | 100% | |
| Cost of Goods sold | 69% | 81% | 72% | 77% | |
| Gross Profit | 31% | 19% | 28% | 23% | |
| Community Rewards | 16% | 17% | 11% | 12% | |
| Operating and other Expenses | 1003% | 324% | 165% | 108% | |
| Total Operating Expenses and Rewards | 1019% | 341% | 176% | 120% | |
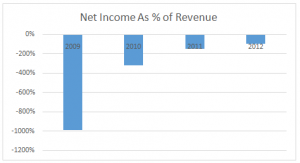
| Net Income | -989% | -322% | -148% | -97% | |
Exhibit C: Community Rewards Analysis
Exhibit D: Net Income Analysis
Exhibit E: Financial Performance Analysis through Comparison
| Comparison of Quirky with other Companies | ||||
| Company (conglomerates, consumer products, technology) | Revenue in $ million | Gross Margin % | R&D as % of Revenue | Operating Margin as % of Revenue |
| General Electrics | 147359 | 0.249 | 0.031 | 0.124 |
| Johnson and Johnson | 67224 | 0.678 | 0.114 | 0.253 |
| 50175 | 0.591 | 0.131 | 0.267 | |
| Quirky | 18 | 0.15 | 0.153 | -0.703 |

