PERABE Early Childhood Intervention Program Case Solution
After that extra special education and extra schooling costs were added to the excel sheet provided with the percentage of PECIP group in pre-seen case material. In project participant and families section the calculations were done on basis of mother earnings and the earning will come from future generations, in addition the earnings of the participants contributed more in this section. Cost savings from carers based on opportunity cost were also added in this section and recorded under earning section of the excel sheet, furthermore, health benefits and benefits from the longevity of the life of individuals were added as huge savings for the project. After subtracting the costs from reduced crimes and federal welfare admin in other stakeholder’s section the efficiency benefit was calculated as shown in excel sheet. The IRR calculated based on net efficiency benefit effect in the project is 9.4% compare to discount rate of 5%. The IRR is comparatively higher than all other IRRs because of cashing opportunity coasts and adding all possible cost savings. The NPV of the project was positive and attractive is case of efficiency BCA, the NPV was showing the trend of decreasing if we increase the discount rate. To calculate NPV with other two discount rates the loan was also discounted with the respective figures.
Through this we have calculated the total net private benefits, after this calculation we have calculated the net project benefits. You can see this in below mentioned graph.
Project IRR is;
| Efficiency IRR = | 9.4% |
To perform sensitivity analysis, we used three real discount rates to find the net present value (NPV) at all three different discount rates. At roughly estimate, we can analyze by looking the internal rate of return (IRR) who gives the 9.4% return on this project, shows that at discount rate of 3%, our NPV will higher than 5% and 7% discount rates. This ultimately shows that at the rate of 7%, our NPV from efficiency cost and benefit analysis will low from the NPV at the rate of 5% and 3%.
| NPV at 5% | $174,011.69 |
| NPV at 3% | $505,300.44 |
| NPV at 7% | $54,985.09 |
Referent Group Cost and Benefit Analysis:
For the calculation of referent group BCA, the method of calculating IRR was a bit different, in difference, the working table calculations were done on the basis of net benefits to families (referred to private BCA) and cost of unpaid carers along with longevity. The calculations included all the figures based on total strength of participant in PECIP group. In the working of other state government, the calculations include health cost savings CJS and rent gained during the defined period.
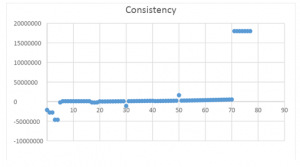
In disaggregated RG net benefit the aggregated costs form educational department were included (department cost per child multiplied to total children in PECIP group). Similarly, the value forms the workings of PREABE participants and other state government were listed into their sections. Moreover, in other community section wages of teachers and paid carers in total were added as a cost but the savings from volunteers were also listed in total. In referent group BCA there was addition of calculations in working area of non-RG net benefits regarding loans, income taxes and duties. In all other calculations of IRR, we didn’t used taxes anywhere. The consistency check is the net effect of all the figures above and a step ahead from IRR.
The calculated IRR based on 5% discount rate is resulting 3.1% showing that the project is not meeting up the pre-hurdle rate’s requirements and hence will make a loss. After calculating the NPV it was proved that the NPV was negative and incurring the loss. Similarly based on the other NPV’s are indicating that the net present value of the project will be more negative if the discount rate of the project increase, similarly, the NPV is positive if the project is discounted with 3% discount rate. In this case the loan was also discounted with the same discount rate before calculating the NPV.
Through this we have calculated the total net private benefits, after this calculation we have calculated the net project benefits. You can see this in below mentioned graph.
Project IRR is;
| Efficiency IRR = | 3.1% |
To perform sensitivity analysis, we used three real discount rates to find the net present value (NPV) at all three different discount rates. At roughly estimate, we can analyze by looking the internal rate of return (IRR) who gives the 3.1% return on this project, shows that at discount rate of 3%, our NPV will higher than 5% and 7% discount rates. This ultimately shows that at the rate of 7%, our NPV from referent group cost and benefit analysis will low from the NPV at the rate of 5% and 3%.
| NPV at 5% | ($9,864,857.93) |
| NPV at 3% | $1,282,928.48 |
| NPV at 7% | ($12,060,932.24) |
Case Assumptions:
- Department of education’s control group has only one carer.
- The bank loan is discounted on 5% discount rate and we pay 3% interest rate on it. So, ultimately other 2% are beneficial for us and we assumed that it’s our savings.
- The total number of groups in year 1 and 2 are rounded off from 12.5 to 13, because the drivers and other equipment’s could not be half.
- Department of education has allocated 1 driver for each group of PECIP.
Conclusion:
Finally, after analyzing all the data, its sensitivity analysis and IRR, we concluded that the efficiency cost and benefit analysis has the highest IRR (9.4%), which shows that if discount rate will reach at 9.4%, our NPV from PECIP project will be 0. If real discount rate will increase from 9.4%, then our NPV from this project will be negative else not. It shows that we have enough efficient to get the more benefits from market........
This is just a sample partical work. Please place the order on the website to get your own originally done case solution.


