Finance Performance Management Case Study Help
Introduction
This inquiry endeavors to carry out a ratio analysis of the economic standing of Wilmar and Olam, two leading food processing corporations. Moreover, it strives to assess the Balanced Scorecard as a system for strategic management by elucidating its rationale and conducting a review. Likewise, it puts forth a careful appraisal of the benefits and difficulties that come with the implementation of Integrated Reporting, with a specific focus on Wilmar International.
Converting raw agricultural materials into edible products is the main objective of the food processing industry. This industry is indispensable when it comes to lengthening the lifespan of perishable goods, providing delectable flavors and textures, maintaining nutrition safety, and catering to customer requests for ease and diversity. Multiple tasks, from segregating to labeling, are involved in this sector.
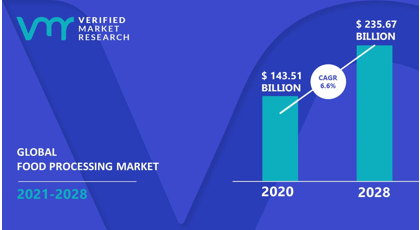
In the past few years, the food processing industry worldwide has experienced phenomenal progress due to its pivotal function in satisfying the ever-growing appetite for processed food items. With a market worth almost $143.51 billion last year, projections show that it could grow up to about $235.67 billion through 2027, displaying multiple yearly growing rates (CAGR) of about 5.2%.
There are multiple reasons for this growth. Primarily, evolving consumer behaviors and tastes have increased the demand for effortless and instantly consumable food products. Emerging economies' middle class and urbanization have increased the popularity of packaged and processed foods. Furthermore, production efficiency, food safety, and product quality have been significantly improved through technological innovation.
Figure 1: Global Food Processing Market
Financial Performance Using Ratio Analysis
Profitability Ratios
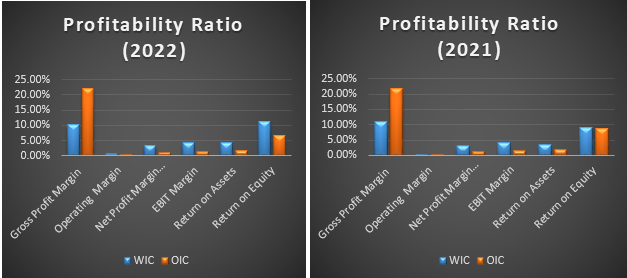
Through an examination of the financial figures in the annual report of Wilmar International and Olam International for both 2021 and 2022, a comparison of their profitability points to some noteworthy trends. Comparing the two, Wilmar International's gross profit margin was a tad lower in 2022 compared to 2021, whereas Olam International enjoyed a minor increase for the same period, signifying a boost in generating profits from sales against Wilmar.
Nevertheless, the net profit margin for both firms went down, with Wilmar International maintaining the upper hand in the overall margin. Generating more earnings per dollar of revenue seems to have been more efficiently done by Wilmar International. Shareholders benefited from higher returns and more effective utilization of assets, as evidenced by Wilmar International's improved ROA and ROE. On the other hand, Olam International saw a decline in ROA and ROE.
Figure 2: Profitability Ratio (Graphs)
Leverage Ratios
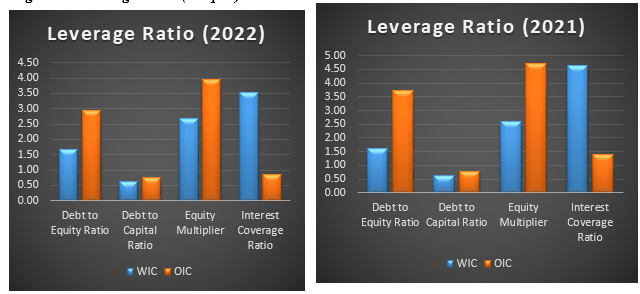
Distinctive approaches toward capital structure are observed between Wilmar International and Olam International, with Wilmar opting for a higher proportion of debt financing versus equity financing. The company's shift towards increased reliance on debt is noticeable through its rising debt-to-equity ratio between years; moving from 1.60 in 2021 up to 1.67 in 2022. These changes signal that Wilmar has incurred larger amounts of debt compared with its available equity which may increase their financial exposure and lead them into likely situations where interest payments have priority.
Furthermore, Wilmar International's debt-to-capital proportion enlarged from 61.51% in 2021 to 62.58% in 2022. This signifies that debt represents a larger portion of the company's total capital structure. It indicates that a significant portion of Wilmar International's funding is derived from debt sources rather than equity. The equity multiplier, which measures the proportion of assets funded by equity, also increased for Wilmar International from 2.60 in 2021 to 2.67 in 2022.
This proposes that the corporation's assets are more leveraged, meaning a higher reliance on borrowed funds to finance its assets. However, it is important to note that Wilmar International's “interest coverage proportion” reduced from 4.65 in 2021 to 3.51 in 2022. This indicates a slight decay in the corporation's aptitude to shield interest expenditures with its operating earnings. A lower interest coverage ratio could imply increase financial risk and the potential challenges of meeting interest obligations.
Figure 3: Leverage Ratio (Graphs) Finance Performance Management Case Study Help
case solution."}" data-sheets-userformat="{"2":4481,"3":{"1":0},"10":2,"11":0,"15":"arial,sans,sans-serif"}">This is just a sample partial case solution. Please place the order on the website to order your own originally done case solution.
Related Case Solutions & Analyses:
 Cherries With Charm: Turkeys Alara Agri
 Crack in the Mug: Can Starbucks Mend It
 Research in Motion: Managing Explosive Growth
 Biocon Ltd. Building a Biotech Powerhouse
 Nora-Sakari: Proposed JV in Malaysia (Revised)
 Product Portfolio Planning at Estonias Saku Brewery
 Samsung: Redefining a Brand
 Staffing Wal-Mart Stores Inc. (A)
 Cola Wars in China: The Future Is Here
 Xiamen Honda 4S Shop


